Countering Component Distortion with Perspective

Download

Countering Component Distortion with Perspective

Injection Molding Simulation Is a Powerful Tool for Quality Assurance
During the manufacture of complex injection molded parts, component distortion is frequently accepted as a matter of fact. A comparison of simulated distortion results with real component distortion shows that this is not necessarily so. Studies with an electric component revealed a concordance of 90 %.

Author: Jan Bayerbach /H&B/ Electronic

First published in Kunststoffe International 09/2014, page 53-57 


To an increasing degree, technical plastic components combine numerous functions. High dimensional stability and component strength are required to meet the resulting demands. For developers and manufacturers this means recognizing component distortion as early as possible during the development procedure, and taking suitable counter measures. Here, injection molding simulation can provide support, whereby it must be noted that a well-founded statement about component shrinkage and distortion requires a holistic view of the injection molding process. This begins with the component’s design, and extends through material selection and mold de[1]sign up to the processing parameters.

Virtual Start-Up with Multi-Cycle Analysis

This holistic or processing approach is the main feature of the Sigmasoft simulation software package (supplier: Sigma Engineering GmbH, Aachen, Germany). It covers the following principles:

  • The simulation takes into account all relevant geometries – from molding, insert, and runner system up to the mold and tempering channel run – in complete 3-D and in any required detail.
  • The software reproduces the entire injection molding cycle and the processing parameters in accordance with the machine settings. In this way, the individual phases of filling, holding pressure, and cooling are represented in a highly realistic manner. Also the subsequent cooling of the molding outside the mold is taken into account.
  • The so-called multi-cycle analysis offers the possibility of starting the injection molding process virtually, and then carrying out the actual injection molding simulation after a defined number of cycles.

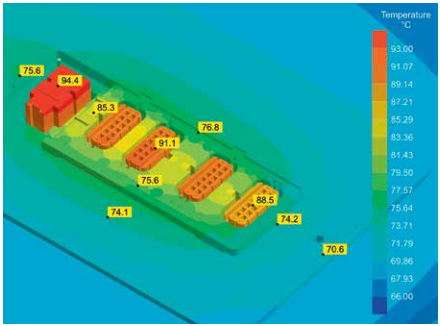
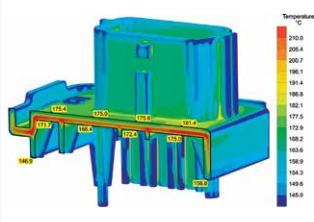
The property named in the last item represents an important aspect, as it means that the thermal boundary conditions at the beginning of the simulation are not based on a static mold temperature, but rather on the temperature distribution of a steady-state injection molding process (Fig. 1).

But is simulation really able to predict component distortion? And if so, how accurate and reliable are the results? With the aim of answering these questions, /H&B/ Electronic GmbH & Co. KG in Deckenpfronn, Germany, conducted a study in which the distortion results of an injection molding simulation are compared with the results gained with practical tests. The investigated component was the insulating body of a multi-pole connector (Fig.2) made of propylene with 25 % glass fiber reinforcement.

 (c) /H&B/ Electronic

Fig. 1: Inhomogeneous mold temperature at the beginning of the 20th cycle. The thermal boundary conditions have a great influence on the simulation result

Amongst other things, the study was intended to assess how realistically the simulation reproduces the actual injection molding process – i. e. whether it consistently follows the processing approach. Consequently, for a realistic assessment of distortion behavior, it is also of interest to know how sensitively the software reacts to changes of those phenomena that have a decisive influence on distortion:

  • (inhomogeneous) heat balance of the injection mold and the molding, in particular the plastic’s thermal history,
  • component geometry with locally varying geometric stiffnesses, such as ribs, and
  • anisotropic, i. e. direction-dependent shrinkage, for example due to the influence of the fiber orientation.

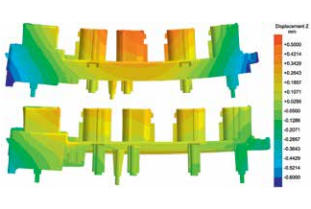
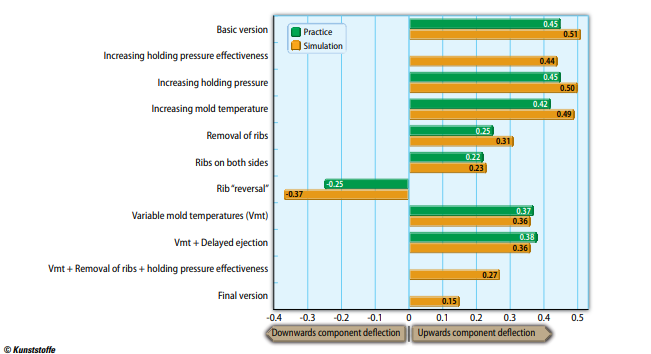
The first simulation is carried out with the processing parameters used for normal production. This is done to acquire first findings about the accuracy of the simulation results. Component geometry and mold design correspond with the real conditions. The results of the comparison with the real component are impressive: While the components manufactured with the normal settings exhibit a deflection of 0.45 mm, the simulation achieves a value of 0.51 mm, and therefore a convergence of 87 %.

Two Effects: Anisotropic and Volumetric Shrinkage

In the subsequent simulations, the influences of selected parameter changes on Fig. 2. Insulating body of a multi-pole connector made of PP-GF25. Base plate thickness is 1.7 mm, and connector housing height is 16 mm. The simulation shows component deflection before (top) and after optimization (bottom) the distortion result are determined. Nature and extent of the changes are based on the detailed analysis of the previous simulation results, particularly taking into account the shrinkage differences within the component volume. Because these are generally assumed to be the cause for component deflection, it is worthwhile to differentiate between two effects at this point, namely anisotropic – i. e. direction-dependent – and inhomogeneous volumetric shrinkage.

Fig. 2: Insulating body of a multi-pole connector made of PP-GF25. Base plate thickness is 1.7 mm, and connector housing height is 16 mm. The simulation shows component deflection before (top) and after optimization (bottom)

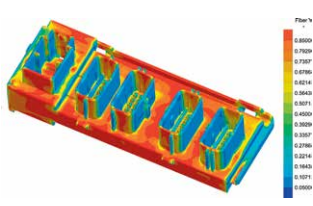
The first of these effects is due to direction-dependent material properties, caused e.g. by orientations, mainly in combination with glass fibers. For example, the simulation result shows a tendency for strong fiber orientation in a preferred direction (Fig.3). However, in those areas in which the melt is deflected, it is interrupted by regions with less fiber orientation. The resulting anisotropic shrinkage represents one of the causes of component deflection.

Fig. 3: Dominant fiber orientation in the preferred/longitudinal com– ponent direction (red), and less-oriented areas result in direction-dependent shrinkage differences and anisotropically-induced distortion

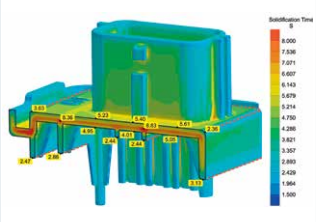
When evaluating the volumetric shrinkage, several aspects must be taken into account. In most cases, temperature and solidification time play a decisive role. A conspicuous observation in this respect: During the holding pressure phase it is not possible to maintain the plastic core. In fact, due to thin-walled regions in the component, not all regions are adequately supplied with melt. Result: The corresponding regions solidify without holding pressure, and therefore exhibit a considerably higher volume contraction than the rest of the component. This inhomogeneous volumetric shrinkage then leads to internal stresses that finally result in component distortion (Fig. 4).

Conversely, these inadequately supplied regions represent melt accumulations or hotspots – again based on the result for solidification. In other words, regions that solidify considerably later than the rest of the component. This delayed volume contraction also leads to stresses, and consequently to distortion. Such differences in volumetric shrinkage, even if moderate, are observed throughout the component. They are mainly due to different cooling rates caused by restricted heat removal or heat transfer. Using the normal parameters, the solidification time from the outer edges and the component ribs to the inside exhibits a difference of 4...5 seconds, thereby promoting the inhomogeneous volumetric shrinkage (Fig. 4).

Fig. 4: Differences in solidification time across the component’s cross-section result in uneven volumetric shrinkage and distortion. Regions that solidify quickly, such as ribs or corners, create stiffening elements and thereby also promote distortion

Influence of Component Geometry and Material Stiffness

After these observations, the question regarding the direction of distortion still remains. Here, a detailed look at the temperature distribution is worthwhile, e.g. during the holding pressure phase. This reveals a shift – albeit minimal – of the higher temperature in the direction of the “concave” (upper) component side, roughly the range of 5...10K (Fig.5). Although this temperature difference seems to be moderate, it still means a simultaneous shift of volume contraction, and therefore a deflection towards the hot side.

Fig. 5: Temperature distribution – here in the holding pressure phase – influences distortion. The temperature at the upper component side is 5...10 K higher than on the lower side

The differences in temperature distribution can be explained by looking at the results of cooling rate and heat flow. It is clear to see that due to the component’s geometry, far more heat must be removed from the upper component side than from the lower side. An additional complication is that mold tempering is considerably less efficient here, also due to the component’s geometry.

A significant percentage of the distortion must be ascribed to component geometry and material stiffness, which also have a strong influence on the direction of deflection. While the corners and the ends of the ribs on the outside of the component have solidified after 2...3 seconds, the material in the component center requires 5...7 seconds (Fig. 4). Moreover, because the material’s strength increases during solidification and also with falling temperature, this leads to two further effects. Firstly, the early solidification of the circumferential corners results in a highly rigid frame, whereby the subsequent contraction of internal regions increases the previously described distortion effect. Secondly, the ribs cause an extreme stiffening of the “convex” (lower) component side. This in turn leads to a shift of the subsequent contraction in the direction of the already hotter component side, which finally becomes apparent in the observed deflection.

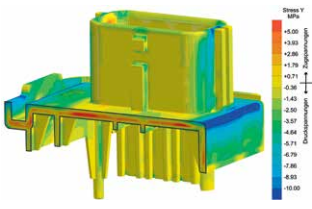
The distribution of stress across the component’s cross-section at the time of demolding confirms this effect. Distinctive hereby are the remaining tensional stresses inside the component, which indicate a continuing contraction and are in opposition to the compressive stresses in the outer component regions (Fig. 6).

Fig. 6: Stress condition immediately after demolding. Tensional stresses (red) indicate continuing shrinkage, thereby promoting distortion

Measures to Minimize Distortion

Specific measures can be derived from the analysis of the simulation results, whereby at this point the number of simulated parameter changes is limited to those that can actually be compared with practical tests (Fig. 7).

The attempt to increase the effectiveness of holding pressure by increasing the pressure level does not improve the distortion behavior. Indeed, although an increase of internal pressure can be observed, the geometry-induced break of the plastic core still results in large regions solidifying without holding pressure. Also the practically unsuccessful increase of mold temperature showed that the problem really is geometric, and only caused the break of the plastic core to be shifted backwards in time, and cooling behavior was only marginally more homogeneous. Consequently, both measures are not effective – on the contrary, it is well known that they represent a considerable risk for component quality, particularly in combination.

Due to their substantial influence on the overall result, component geometry and material stiffness offer the greatest potential for minimizing distortion. This is confirmed by the results of two optimization measures (Fig. 7). For example, the first test – in which the ribs were moved to the other component side – showed that the stiffening effect and ultimately the component deflection are reversed, both in the simulation and in practice. This effect is made clear by the analog shift of solidification time, volumetric shrinkage, and stress distribution. In a second test with a component that has practically no ribs, a homogeneous and symmetric stress distribution was observed, with virtually no extreme stress peaks. Accordingly, also here the component deflection is significantly reduced.

Fig. 7: The effectiveness of various measures for reducing warpage can be derived from the component’s deflection (unit: mm). Comparison with the real components shows a high concordance

Ideally, optimization of the (uneven) volumetric shrinkage requires symmetric cooling conditions and/or a homogeneous temperature distribution. In the example described here, optimization of mold tempering, e.g. through conformal cooling, is not possible. Therefore, the only possibility to counteract the impeded heat flow in the upper component side consists of creating a higher temperature gradient within the mold.

In practice, this means reducing the cooling medium temperature in this area, thereby removing more heat. The result is a 0.15 mm reduction of reflection in the simulation, and 0.08 mm in practice, accompanied by a drastic reduction of residual stresses, both before and after demolding. Analogously, volumetric shrinkage is very homogeneous, and exhibits a clearly lower value.


Rib Straightens the Component during Cooling

How large the frozen stresses finally are, and how strongly they act on the component, is demonstrated in the final unsuccessful attempt with delayed ejection. Hereby, and in order to prevent shrinkage on one side, the upper component side remains in the cavity on the ejector side for a certain time after the mold is opened. But the result of 0.36 mm (0.38 mm in practice) permits the conclusion that even before the mold is opened, the component already contains so many residual stresses that this measure has no effect.

Worth mentioning, although not verified by practical tests, is the attempt to increase holding pressure effectiveness. In this case, and with the aim of supplying additional melt to all areas for as long as possible, flow promoters in the form of thick ribs were included on the (lower) component side, which solidifies earlier. However, the improvement of 0.07 mm is by no means due to an optimized supply of dwell pressure. In fact, it is shown that the rib cools down relatively slowly, thereby “pulling” the component straight after demolding. Remarkable: The same measure without the stiffening elements and with a variable mold temperature resulted in a deviation improvement of 0.12 mm (Fig. 7).

In conclusion, the study includes a final simulation, which combines several measures for optimizing deformation:

  • increased holding pressure effectiveness,
  • varying mold temperature, and
  • removing ribs.

Although no practical test has been carried out for this combination of measures, the deflection of 0.15 mm achieved by the simulation indicates a clear improvement of component quality. Based on the positive results of the prior simulations, it is safe to assume that this version will also minimize distortion in practice.

Summary

In all cases, in which the calculated component distortion can be verified by practical tests, the values coincide closely. Consequently, the quality of the simulation results is very high. Moreover, the software is able to demonstrate all three phenomena that are relevant for component distortion – thermal, geometrical, and anisotropically-induced distortion – thereby permitting targeted optimization measures.

Not least because of these positive results, /H&B/ Electronic has meanwhile established injection molding simulation as a permanent element of its development procedure. The first simulations to optimize the component’s design are carried out very early, followed by additional simulations during the further project stages and taking the mold design into account. In conclusion, a process simulation before the mold is commissioned forms the final quality check.